SimplyDraw - Step Functions
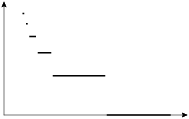
This example takes advantage of a feature which is not yet found in PyX: a graph style for plotting step functions. Just use it as a replacement for style.line when you know that your graph will be a step function.
It would certainly be nice if style.steps could handle arbitrary discontinuous graphs, but this has yet to be implemented in a nice manner.
g = mathxy(height=4,
        x=axis.linear(min=0, max=3.3, parter=None),
        y=axis.linear(min=0, max=2, parter=None))

g.plot(data.function(lambda e: log(floor(exp(e**-.6))),
        min=0.001, max=3),
        [style.steps([linewidth.THick, linestyle.solid])])

insert(g)