SimplyDraw - Stacking Graphs

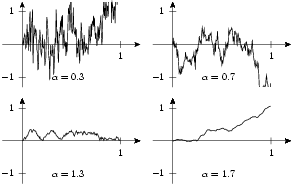
Here you can see a typical situation which can make beneficial use of the stack function. Whenever you have to draw several graphs with slightly changing parameters think about using stack.
You just to give the graphs (or canvases, if that's the correct plural form) to stack. The layout is done according to how you passed the graphs. stack takes a list of lists, where the inner lists represent rows. This might sound confusing, but can be used very straightforward.
stack can not only be used globally but also as the method of a canvas.
By the way, the graphs show trajectories of fractional Brownian motions with different fractions.
ga, gb, gh = -.2, 1.2, 1.3

n = 200

def k(j,k):
    s, t = j / float(n), k / float(n)
    return .5 * (s**a + t**a - (abs(t-s))**a)

G = []
for a in [.3, .7, 1.3, 1.7]:
    g = mathxy(height=3,
            x=axis.linear(min=ga, max=gb, parter=None,
                manualticks=[tick(1)]),
            y=axis.linear(min=-gh, max=gh, parter=None,
                manualticks=[tick(-1), tick(1)]))

    K = fromfunction(k, (n, n))
    X = zip([ i / float(n) for i in range(n)],
        multivariate_normal(zeros(n), K))

    g.plot(data.list(X), [style.line()])
    g.dolayout()

    x, y = g.pos(.3, -1)
    g.text(x, y, "$\\alpha=%.1f$" % a, [halign.left, valign.middle])

    G.append(g)

stack([[G[0], G[1]],
       [G[2], G[3]]])