SimplyDraw - Brownian Motion
Here you can see another example of the usage of data.function. Note that a real Python function is passed instead of a string.
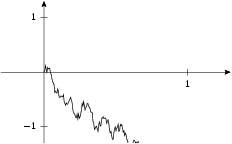
For those who wonder: we could have drawn the trajectory similar to this example, but here we used an expansion.
a, b, h = -.3, 1.3, 1.3

g = mathxy(height=5,
    x=axis.linear(min=a, max=b, parter=None,
        manualticks=[tick(1)]),
    y=axis.linear(min=-h, max=h, parter=None,
        manualticks=[tick(-1), tick(1)]))

n = 200
x = standard_normal((n,))

def bm(t):
    w = x[0] * t
    for i in range(1, n):
        w += x[i] * sin(i*pi*t) / i / pi
    return sqrt(2) * w

g.plot(data.function(bm, min=0, max=1, points=n))

insert(g)